HOG, Harley-Davidson Inc

Like on Wallstrip, today I look at HOG, the ticker for Harley-Davidson Inc.

This should be a somewhat simple review of the chart though. Lets look at about a year of daily data.

HOG from 10/30/06

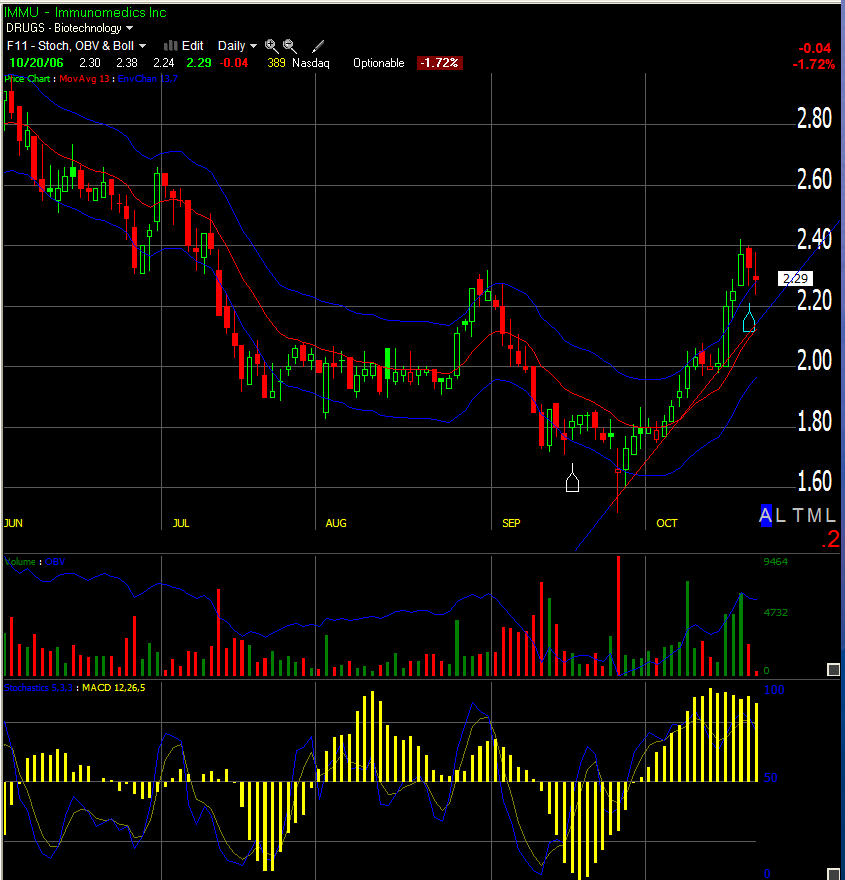
First, I own no HOG and have no plans of getting in. The chart does reveal a nice uptrend which started mid-June. The MACD and the OBV lines confirm the trend. The growth has been careful, never pulling far away from the MA13 line or the trend line. I see no sign of real weakness in the trend at the moment and nothing points to an imminent reversal so I would consider getting long here even if it is a little late in the trend. Finding an entry would probably just consist of making sure I get in somewhere between the trend line and the MA13 line. I would hate to get in just to see the price pullback to safety.

So overall attractive for a long but watch out for reversals as this is not a recent trend.

MO, Altria Group Inc.

This morning I look at MO, the ticker for Altria Group Inc., the parent company of Kraft Foods, Philip Morris International, Philip Morris USA and Philip Morris Capital Corporation. First, here is the link to today’s Wallstrip show on the same ticker.

This chart gave me a hard time. MO displays a somewhat choppy and slow growth. To help understand the shorter timeframe, here is a look at a chart covering several years of weekly data:

MO Weekly from 10-25

If you asked a two year old to draw a stockchart in school, this is more or less what it would look like. I do not own any MO and have no plans of getting in but if I did, I would probably look to get in long. You can trade MO really either way but my comfort would be on the long side.

Altria had a nice run starting mid-June which was confirmed by a golden cross in early in July. The run was abrubtly interrupted late in September with bad news on the legal front (an important element for all the big tobacco companies). The price pulled right back to the MA200 line.

MO Daily on 10-26

Although the price started increasing again and the trend-up seems to have resumed, the MA50 line is still dipping down for a symbol like MO, I would wait for a confirmation from the moving averages before getting in.

Exits on 10/25/2006

Actualy, one of those is from 10/24, I just never got around to posting it. I love how the market works, it’s the greatest taunter in the world. It lets you run with it for a while, making better and better trades. It lets you gain confidence a little bit and just when you start to get confortable… WHAAAAAPPP!!!

Type Sym Date/Price In Date/Price Out R-Mult
CGNX 10/20/2006@22.81 10/24/2006@22.43 -1.37R
CVH 10/20/2006@50.70 10/25/2006@49.23 -1.38R

Nike's uptrend

Following Wallstrip’s daily video on NKE, here is a quick analysis of Nike’s chart. Keep in mind I own no Nike and do not plan on aquiring any. I am doing this for practice which means I am very green when it comes to analysis like this.

Nike has been in a very nice uptrend since late august. This trend included a 4.7% jump on positive earnings report on September 22nd. Looking at a year and a half of daily data, we see NKE break through two prior resistance levels, around 84.5 and around 87.5. The next step for Nike is the 91.5 prior high from December of 2005.

At the moment, the volume is declining and the MACD histogram has turned, showing less and less support for the trend. As a result, the price has pulled back towards the trendline and the 13 days MA line.

At this turning point, I would not get invovled with NKE. I would wait for a confirmation of movement in either direction. The trend could resume increasing the price away from the MA line, which would make Nike attractive for a long position and would more than likely take the price through the 91.5 resistance. Or the price could break downwards through the trendline and make the instrument attractive for a short. In case of down movement, the price would probably look for support around the prior resistance level, around 87.5.

nke-102406.png

Google Reader vs Bloglines

Off trading and onto “tools” for another post. Mind you this is in line with The Blogging Times Today interview with Nicholaus Baum and with Wallstrip‘s coverage of GOOG. A couple of weeks back I posted about trying Google Reader instead of Bloglines. Well I would like to apologize to IACI publicly for doubting them and their product (notice how I keep this a stock market related blog by throwing a symbol in a completly unrelated post). I tried Google Reader but I am now back to Bloglines.

I know Bloglines may not be the cuttest thing around but you have to give it to them, it has all the functionalities it needs and it is fast.

I liked the “look” of the user interface in Google Reader a lot more but I found that:

  • Switching from feed to feed was much slower on average and
  • adding a new feed was taking me twice as long (add first than go back and put in right category).

Overall, even though it did look better, I was not gaining anything with regards to functionality and I was slowing my morning routine down to a point where I was skipping some of my categories to save time. So I am now back to Bloglines and I will stick to it for now.

Immunomedics post-mortem

Yesterday I posted my IMMU trade results (see below) and today I wanted to comment a bit.

Type Sym Date/Price In Date/Price Out R-Mult
IMMU 09/18/2006@1.82 10/19/2006@2.35 4.75

I also have a chart available:

IMMU

My biggest question on this trade is whether I exited too soon or not.

I usually set my stops based on prior days lows. My most common stop is one tick below the prior day’s low. But sometimes, specialy during steap uptrends, I will keep the low from a couple of days before in place. Yesterday, IMMU crossed below Wednesday’s low but not by much and I ended up bailing out anyway to protect my gains. Looking at the chart, I see the Stochastics still strong and very little volume support to the decrease in price. This leads me to believe in may be a very temporary situation and *not* the end of the trend up. The price may just pullback towards the trend line, around 2.25 and keep going up from there.

Either way I am out with my 4.75R banked in but I may have missed on more profits from this updrend by exiting the trade a little prematurely.

Exits on 10/19/2006

This problem I will need to address at some point. LBIX crossed under my stop level yesterday. But because of the size of my account, I need to avoid day trading for now which means avoiding getting out on the same day I got in. I can get away with a few of them in a week but I have to be careful.

Type Sym Date/Price In Date/Price Out R-Mult
LBIX 10/18/2006@4.22 10/19/2006@4.07 -1.33R
IMMU 09/18/2006@1.82 10/19/2006@2.35 4.75
NWY 10/18/2006@13.35 10/19/2006@13.15 -1.34R

powered by performancing firefox

How long can Adobe sustain this…

I rarely (read never) write about a symbol just like that but this week, following the Wallstrip show, I have done a little digging around on the symbols covered on the show. So for Thursday October 19th, I looked at ADBE and decided to post on it.

At the risk of embarassing myself but because I need to practice, I am posting my ADBE commentary (solely based on the charts) before I read the other blogs and head over to Wallstrip Conversations to see everyone’s opinion. I own no ADBE and do not plan on buying any.

Although there is not enough indication of a reversal to sell short, I would not get into a long ADBE position at this point by fear of it being oversold at the moment. Although the price is trending up, the volument has started declining showing less and less support for the trend. It has basicaly been a consolidation since the 10% gap up on positive earnings news on 9/15/06. I would not be surprised if broke the sideways action downwards soon to find a decent support level. I would expect to see, first, a pullback to the lower channel or around 36.50. Once the price dips below that 36.50 level, it should start a downtrend.

ADBE on the close of 10/18/2006
For more, you can look at: