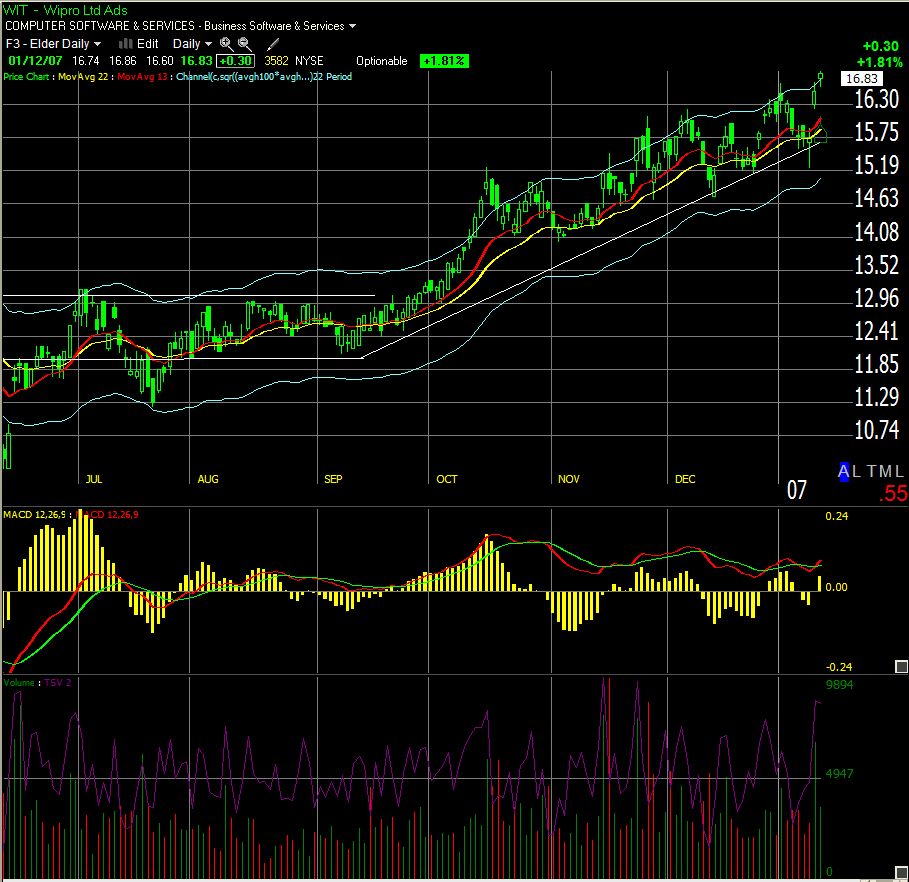
Wallstrip looks at WIT and so are we. WIT is an India based IT provider. Founded in 1945, it now has about 53,700 employees and has a slightly over 24B of market cap. WIT has been trending up pretty steadily since the bottom at 3.05 in May of 2003. Trading at a comfortable 16.83, WIT could be a long candidate.
First, I look at several years of weekly data. We can visually confirm the nice trend up from 05/03. I broke the trend in multiple sections composed of periods of heavy increase followed by consolidation. The first increase was the most dramatic, going from its low 3’s low to a high around 9.30 in six month. Early in 2004 to price needed to consolidate a bit but it quickly started up again, though not as aggressively as before. The price consolidated for most of 2005 and jumped up from the end of 2005 to early in 2006. More consolidation mid-2006 following by the current uptrend.
Several things worry me about this pattern. First, the fact that each uptrend has had less and less support, was less agressive and less explosive, shows that we could be looking for a major resistance. This last uptrend started mid-06 has a negative slope on the MACD histogram. Nothing on here tells me I should short this stock but I would not jump in at this point in the game. I may keep watching it, to see how it progess but for now, I stay on the sidelines.
Even though I made a decision to avoid the stock on the weekly charts, I will take a look at the daily data. The last clean upswing was in early October. Everything after that gets very choppy which makes finding clean swings very hard. If anything, shorting the pullback would probably be easier as the lines are pretty clean but I generally avoid trading against the trend. The MACD histogram divergence and the MACD divergence confirm I want to avoid this stock for now.
Only thing I would consider right now is waiting for a clear sign of reversal and shorting this one on the downtrend.


