MCD (McDonalds Corp) is featured on Wallstrip today. I wanted to send this out earlier but the day took over the schedule. MCD has been trending up since early in 2003 and on 01/17/2006, MCD hit its 260 days high of 45.06. After a short correction, the price is now re-testing that last resistance, currently trading around 44.73.
On the weekly chart:

We clearly see the massive uptrend but are also getting signs that the bulls are losing control of the price for the time being. We have seen several blue impulse signals on the chart and the price seem far away for the current trendline. Given the fact that was have seen corrections on MCD around April of almost every year, it is probably NOT the right time to get in long. If we saw a good correction back towards the EMA lines and the trendline and the trend show signs of recovery, we could get a nice entry. I always find it tricky to get in 3 year old trends but you never know, Mcdonalds usually manages to do some things right.
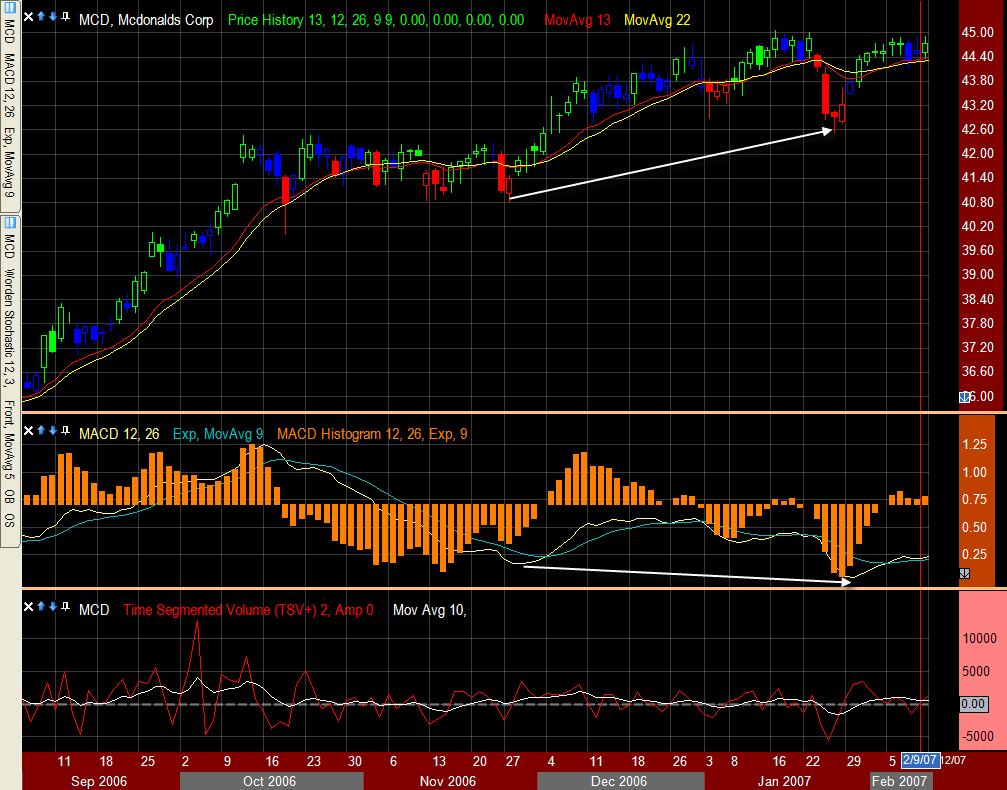
Even if a current trade is pretty much out of the question (unless someone was interested in shorting the correction), I will take a look at the daily chart anyway:
The daily chart, though it gives us a green impulse, is probably near a reversal. The weekly chart was a little more telling but the daily chart still supports the concept with slight divergence on the MACD line, probably signaling a pause in the current uptrend is coming.
I would expect MCD to trade sideways for a weeks and finaly take a small correction in the March-April time frame. How the chart looks at that point would determine whether MCD is indeed a long candidate or not.
73 de Stoploss.


Thanks canuck :). Youda man
by the way, pls post wallstrip stock reports on our comment section so more people can see the insight and when they go back to review can relink. win/win
I always figured the trackback would pickup this post and link it in the comment section.
You would prefer I manually post a summary in the comment section on Wallstrip with a link back to this post you mean? I could certainly do that…