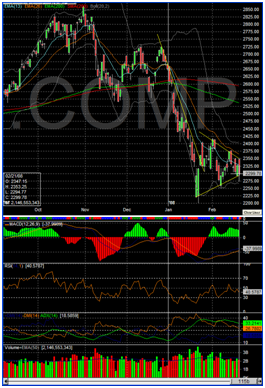
In most market indicator charts, I see two major downtrend moves early this year, each followed with sideways action. We are currently in that second sideways movement and probably near the end as the triangles are closing up. Everybody is looking for a bottom but everyone is on their guard which makes another down movement likely. I think people are ready to buy back an upwards movements and signs of recovery but just as likely to panic and drop out if they see other signs of drop movements. Yesterday word of the day was stagflation.
On a personal note, I do not seem to be trading well in range conditions but I do not know why yet. One of the reasons for this post is to 1) get better a detecting current market conditions and 2) try to improve my trading in all conditions.
Overall, since I trade a lot of break-out candidates, I put money on a lot of false breakouts when the market stalls like this. Trending market, either up or down offer better breakout action I think.
| Long-term | Intermediate | Short-term | |
| NASDAQ | Down | Sideways | Down |
| Dow | Down | Sideways | Down |
| S&P | Down | Sideways | Down |
 |
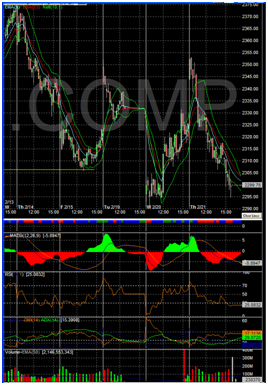 |
| The daily NADAQ composite chart shows the range we are currently trading in. We had to down moves so far this year, each followed with a couple of weeks of sideways trading. | The 60 minute chart of the NASDAQ Composite shows the short-term down movement from Thursday. |
 |
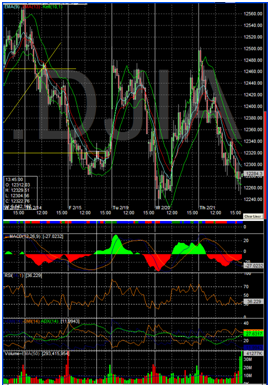 |
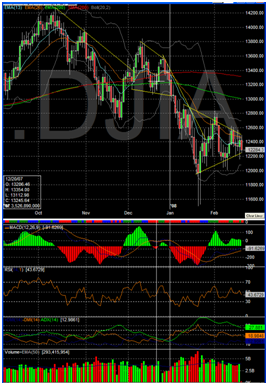
| The DOW showed a similar pattern. The later part of January and February has been in a triangle range/consolidation phase. The triangle is closing up but nobody seems certain of what the next movement will be. | The 60 minutes shows the wide swings this range trading presents. |
 |
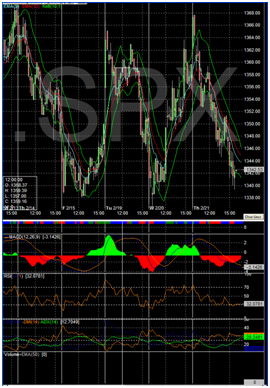 |
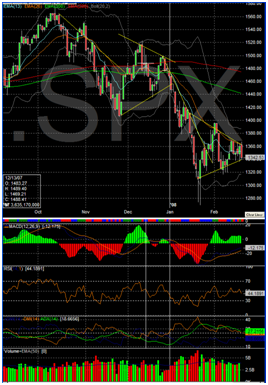
| Again, same pattern on the S&P chart. Two down trend moves and two consolidation phases. We are in the second consolidation. I see no clear bottom indication yet, which doesn’t mean it’s not here. Just means I don’t see it yet. | Again, huge swings on the 60-minutes charts which makes my life a little difficult. I do not handle these markets well. |
