Candidates for 02/07/2008

Here is the list of my candidates for today. I will not trade all of those but will start watching them for short-term reversals.

Date Sym L/S Close MA(200) Vol MA(100) Reason
20080206 ABAX 26.82 25.79 365498 1
20080206 AUY 14.56 12.95 9615135 1
20080206 GSS 3.72 3.67 5146881 1
20080206 MO 72.76 71.45 11396479 1
20080206 NBF 1.96 -1.00 388856 1, 2
20080206 PPDI 42.08 38.45 860186 1
20080206 TRE 5.78 5.56 353270 1

1. 5 Consecutive down days.
2. Volume is 30% over the 10-day moving average.
3. Volume is 70% over the 30-day moving average.
4. Volume is 50% over the 50-day moving average.

Happy Trading!

Candidates for 02/06/2008

Here is the list of my candidates for today. I will not trade all of those but will start watching them for short-term reversals.

Date Sym L/S Close MA(200) Vol MA(100) Reason
20080205 ABAX 27.45 25.78 363196 1, 4
20080205 CNE 13.19 -1.00 1317990 1
20080205 DDUP 20.62 -1.00 410337 1, 4
20080205 IAG 7.54 -1.00 1310900 1
20080205 IVGN 83.43 81.52 811886 1, 2, 3, 4
20080205 NBF 2.02 -1.00 384231 1
20080205 PPDI 42.17 38.42 852939 1
20080205 SMBL 8.8801 -1.00 302742 1, 2

1. 5 Consecutive down days.
2. Volume is 30% over the 10-day moving average.
3. Volume is 70% over the 30-day moving average.
4. Volume is 50% over the 50-day moving average.

Happy Trading!

Candidates for 02/05/2008

Here is the list of my candidates for today. I will not trade all of those but will start watching them for short-term reversals.

Date Sym L/S Close MA(200) Vol MA(100) Reason
20080204 CNE 13.19 -1.00 1317990 1
20080204 DDUP 21.83 -1.00 401332 1
20080204 NBF 2.03 -1.00 382165 1
20080204 PPDI 42.73 38.39 847840 1

1. 5 Consecutive down days.
2. Volume is 30% over the 10-day moving average.
3. Volume is 70% over the 30-day moving average.
4. Volume is 50% over the 50-day moving average.

Happy Trading!

CMO Dip Trip (+0.47)

Traded my first Dip Trip and I am happy with the result. I read “The Master Swing Trader” by Alan Farley several times and still refer to it once in a while. I just never really used his pattern knowingly until now. I started visiting his site recently and he has interesting content. So a couple of days ago, he had listed CMO has a dip trip candidate so I started watching it. Here is the daily chart:
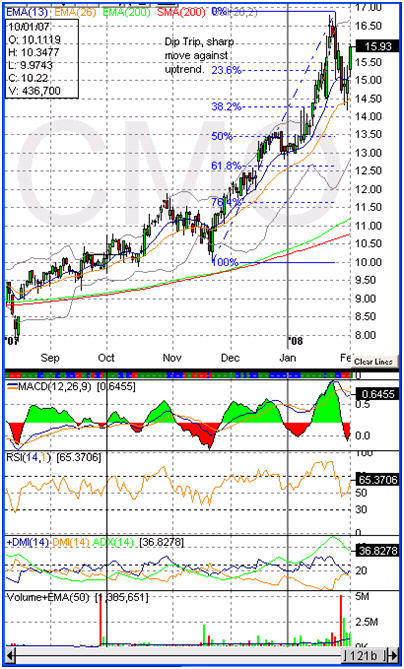

I placed a fib grid on the top of the late November to late January trend. Right after that top, we see the dip starting and it hits bottom around 38.2% as predicted. I started watching the rebound but I was careful. On the hourly chart, I traced a trendline tacking the dip. The line was traced between the top on 1/24 and the congestion levels mid-day on 1/28. Following the action, I saw the price rebound back to that line on 1/30 so I entered. Unfortunately, I miscalculated the impact of the FOMC 3/4 pt rate cut announcement on that Wednesday. At first, the markets rallied so I entered my position after the announcement around 2:45pm, not a time I enter a lot of positions. The rally was short lived and after reading more into Bernanke’s words, the market turned red across the board, taking CMO with it. All through Thursday, the markets were in the red and CMO was falling. I got very close to my stop level but I hung in there and right on the bell Friday morning, the uptrend from Wednesday resumed. Later that afternoon, I had .50pt gains on the trade, it was Friday, and not knowing what the weekend had in store and the market being as volatile as it is now, I cashed out when the price showed signs of congestion later in the day Friday. Looking at the chart now, it’s clear I may have gotten out too early but I sleep better with my money in the bank and Monday I can start looking at other charts.


Hope everyone is having a good Super Bowl weekend. Enjoy the game tomorrow and GO G-MEN!!!

Candidates for 02/04/2008

Here is the list of my candidates for today. I will not trade all of those but will start watching them for short-term reversals.

Date Sym L/S Close MA(200) Vol MA(100) Reason
20080201 CNE 13.19 -1.00 1317990 1

1. 5 Consecutive down days.
2. Volume is 30% over the 10-day moving average.
3. Volume is 70% over the 30-day moving average.
4. Volume is 50% over the 50-day moving average.

Happy Trading!

links for 2008-02-01