CMO Dip Trip (+0.47)

Traded my first Dip Trip and I am happy with the result. I read “The Master Swing Trader” by Alan Farley several times and still refer to it once in a while. I just never really used his pattern knowingly until now. I started visiting his site recently and he has interesting content. So a couple of days ago, he had listed CMO has a dip trip candidate so I started watching it. Here is the daily chart:


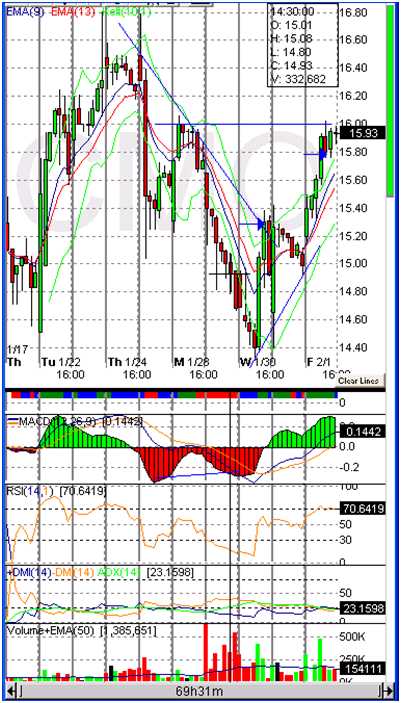
I placed a fib grid on the top of the late November to late January trend. Right after that top, we see the dip starting and it hits bottom around 38.2% as predicted. I started watching the rebound but I was careful. On the hourly chart, I traced a trendline tacking the dip. The line was traced between the top on 1/24 and the congestion levels mid-day on 1/28. Following the action, I saw the price rebound back to that line on 1/30 so I entered. Unfortunately, I miscalculated the impact of the FOMC 3/4 pt rate cut announcement on that Wednesday. At first, the markets rallied so I entered my position after the announcement around 2:45pm, not a time I enter a lot of positions. The rally was short lived and after reading more into Bernanke’s words, the market turned red across the board, taking CMO with it. All through Thursday, the markets were in the red and CMO was falling. I got very close to my stop level but I hung in there and right on the bell Friday morning, the uptrend from Wednesday resumed. Later that afternoon, I had .50pt gains on the trade, it was Friday, and not knowing what the weekend had in store and the market being as volatile as it is now, I cashed out when the price showed signs of congestion later in the day Friday. Looking at the chart now, it’s clear I may have gotten out too early but I sleep better with my money in the bank and Monday I can start looking at other charts.

Hope everyone is having a good Super Bowl weekend. Enjoy the game tomorrow and GO G-MEN!!!

Stops too wide and target too high

Recent KTC chartI don’t know if it’s worsened by the current market conditions and the really high volatility but I really feel like my stops are way too wide and my targets are too high. Look at this chart of a “successful” KTC trade(1), I noticed my stop could have been much tighter.

After analyzing several of my trades, I worry that my stop is way too wide. I was originally setting it much tighter but was getting annoyed seeing trends resume after I was stopped out and missing out on profits. But bottom line is my gains are fairly small, points wise, on each trade. If I only make as much as I risk on every trade, I am saying I can consistently make more winning trades than losing ones. Since I know this is not always the case and at times, I have only 40% winning trades, I might as well bring up my stop level to say 3%. Since I think I can capture, short-term, price gains of 4-6%, it puts me in place where even with 40% winning trades, I’m ahead of the game since I make more on a winning play than I lose on a losing play.

Those are all concepts I’ve read about over and over again but it’s never as clear until you recongnize them in your own trading.

(1) The chart is provided by StockTickr.com which is a great tool to track performance, adjust risk parameters and journal your trades.

Where's Waldo?

I realize my last post was quite a while ago and I probably lost quite a few readers but I guess I will have to live with that. I have been incredibly swamped by work, making trading part-time a real challenge. I have been trying to stay on top of the game still but I am getting killed by the market still.

So basically I am being extra careful and slowing down, reducing my sizes until I can get back in the zone. Right now, I am still going forward and upgrading my system based on new input. But for the last 2 months it has been really really hard. I am about to go back to my notes for Jun-Jul-Aug to see what I was doing different or how different the market was that made those three months a lot easier than Oct-Nov-Dec.

I guess I am like a beginning swimmer. I am okay to survive in calmer waters but I start swallowing water as soon as it gets too choppy.

I have yet to finalize ‘The Plan’. Parameters are still changing very fast and I’m learning from all aspects at the same time: learning about the market, learning about the date and the indictators, learning about the tools, etc. It gets a little tricky when every piece is moving at the same time. Like doing filling-up and doing a tire rotation going 60mph down the highway.

Exits on 11/02/2006

Well it has been a very very bad month and I am getting badly beaten up by the market. I am taking a breather for the rest of the week (today and tomorrow) to try and start fresh on Monday. I am learning a thing or two about my system though:

  • I have lost over 20R in October and gained almost nothing (about 2 1/4 R).
  • my win ratio is down below 40% but my average wins in $ is still double my average loss which helps.
  • so even though picking winners has been a complete failure, risk management has prevented me from going down in flames.

I guess that’s why STOP-LOSS is an appropriate title for this blog. Speaking of which, another title hit the limit today:

Type Sym Date/Price In Date/Price Out R-Mult
TSN 10/30/2006@14.54 11/02/2006@14.22 -0.19R

Exits on 11/01/2006

Again, the market takes a dip and a bunch of my stop-loss orders trigger:

Type Sym Date/Price In Date/Price Out R-Mult
ET 10/26/2006@23.29 11/01/2006@23.19 -0.19R
PBNY 10/30/2006@14.01 11/01/2006@13.92 -0.56R
ULTI 10/30/2006@24.24 11/01/2006@24.16 -0.27R
SFE 10/31/2006@2.44 11/01/2006@2.35 -0.42R

Exits on 10/25/2006

Actualy, one of those is from 10/24, I just never got around to posting it. I love how the market works, it’s the greatest taunter in the world. It lets you run with it for a while, making better and better trades. It lets you gain confidence a little bit and just when you start to get confortable… WHAAAAAPPP!!!

Type Sym Date/Price In Date/Price Out R-Mult
CGNX 10/20/2006@22.81 10/24/2006@22.43 -1.37R
CVH 10/20/2006@50.70 10/25/2006@49.23 -1.38R

Immunomedics post-mortem

Yesterday I posted my IMMU trade results (see below) and today I wanted to comment a bit.

Type Sym Date/Price In Date/Price Out R-Mult
IMMU 09/18/2006@1.82 10/19/2006@2.35 4.75

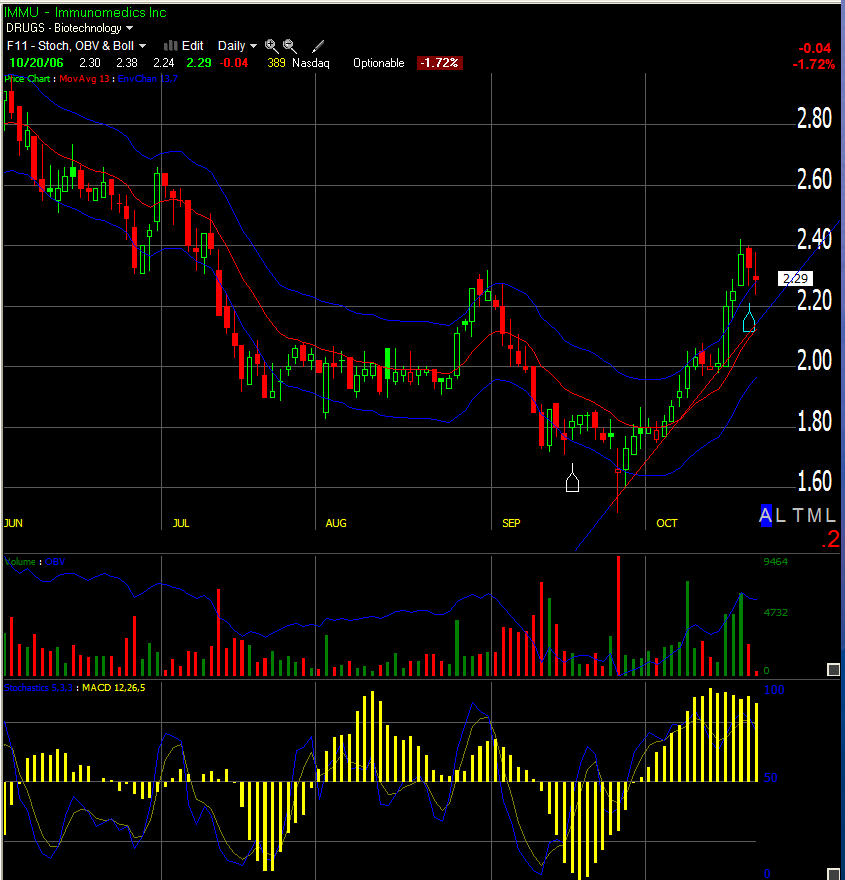
I also have a chart available:

IMMU

My biggest question on this trade is whether I exited too soon or not.

I usually set my stops based on prior days lows. My most common stop is one tick below the prior day’s low. But sometimes, specialy during steap uptrends, I will keep the low from a couple of days before in place. Yesterday, IMMU crossed below Wednesday’s low but not by much and I ended up bailing out anyway to protect my gains. Looking at the chart, I see the Stochastics still strong and very little volume support to the decrease in price. This leads me to believe in may be a very temporary situation and *not* the end of the trend up. The price may just pullback towards the trend line, around 2.25 and keep going up from there.

Either way I am out with my 4.75R banked in but I may have missed on more profits from this updrend by exiting the trade a little prematurely.