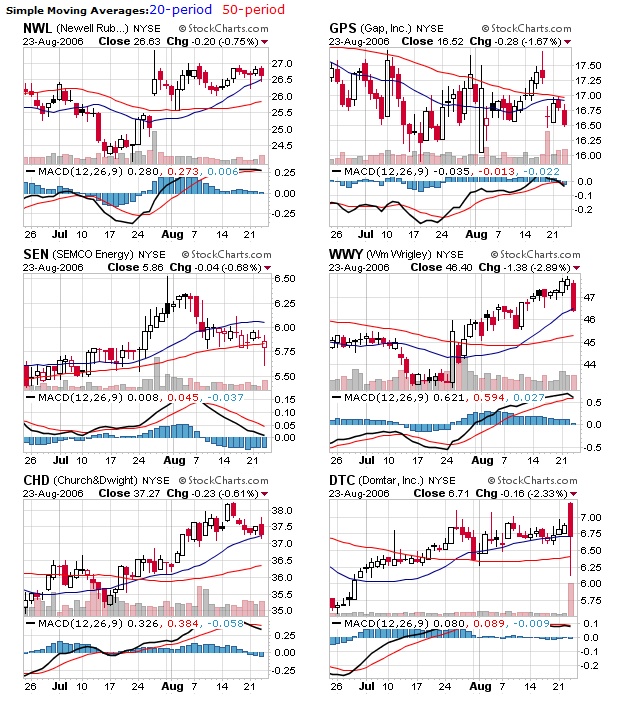
Technical Screens for 11/14/06

Never got around to really looking at those yesterday. Today should be better. Here are the lists for today.

Golden cross between the 50-day moving average and 200-day moving average.

BIIB, DSL, GMT, GR, HDY, HIS, IYT, JBK, KMR, MPX, NBG, RCL, SBW, TRK, TS, XKP

Death cross between the 50-day moving average and the 200-day moving average:

GDI, HTI, PNP, TRI, TX

Technical Screens for 11/13/06

I know I have been pretty quiet recently. Work is insane for one and, as my previous posts have shown, my trading has been horrible. I am not changing anything per say but I am reviewing and scrutinizing everything I do a lot more.

I am trying some screens, all technical, to try and come up with a short watchlist of charts to look at in the morning. The trouble is, my skills analyzing charts need polishing, which means I cannot have a very long list otherwise I will spend all day trying to read the darn charts and I will not get anything done. So the screens may change as I try different versions.

Here are text files for those importing in trading apps: Death Cross MA 50/200 and Golden Cross MA 50/200.

Golden cross between the 50-day moving average and 200-day moving average.

AIR, EMG, IBB, ISO, JNPR, KF, LG, MDP, MMC, MPT, MTA, NDE, NUF, PCH, PMD, ROH, SFE, SPP, TIF, VCF, VMO, WWY

Death cross between the 50-day moving average and the 200-day moving average:

GB, IOT, NNF, PNP, SBK

Watchlist for August 29th 2006

Here are swing candidates and their trigger points for today:

Date Type Sym Close Trigger
8/29/2006 XEL 20.72 20.35
8/29/2006 TNP 46.97 46.61
8/29/2006 ATO 28.48 28.20
8/29/2006 TLS 13.29 13.37
8/29/2006 ASH 63.20 63.72
8/29/2006 KNTA 1.53 1.55

I will be watching for each of these to cross their trigger and than I will try to find a nice entry.

Watchlist for August 28th 2006

Here are swing candidates and their trigger points for today:

Date Type Sym Close Trigger
8/28/2006 BORL 5.52 5.29
8/28/2006 CNMD 19.64 19.31
8/28/2006 DRYS 13.50 12.07
8/28/2006 GNSS 13.77 13.71
8/28/2006 OMNI 9.33 8.62
8/28/2006 KEY 36.79 37.11
8/28/2006 MRK 40.44 40.74
8/28/2006 ONNN 5.83 6.01

I will be watching for each of these to cross their trigger and than I will try to find a nice entry.

Shortlist for August 25th 2006

I am testing something new this morning. I reversed some of my PCFs and I am looking for short candidates. Looking at PCF outputs and charts, I came up with the following list:

Date Sym Trigger
8/25/2006 PPP 44.01
8/25/2006 PHM 27.92
8/25/2006 ABMD 12.63
8/25/2006 NCC 35.22
8/25/2006 GSK 53.85
8/25/2006 IMA 30.95

Once triggered, same rules apply to shorts and longs. I get in, and set a stop above the previous day’s high. The stop than follows the drop to lock-in the profits.

Watch List for August 24th 2006

Here is an overview of the new items on my watchlist for today. I would consider these as long swing candidates. All these are symbols with very bullish outlooks on the weekly charts but are down on the short term. The plan is to wait for a reversal by flagging the items on the watchlist and buying (paper still) if they poke through the previous day’s high. Once in, I fix my target near the upper channel line and set a protective stop somewhere below today’s or yesterday’s low.

WatchList

Charts for today's watchlist

The goal is to stay in from 2 to 4 days and take the profit at the upper channel. A trailing stop order will follow the progress of the stock and bail-out at any sign of pullback.

Currently tracking and Upcoming vacation

I unwound a bunch of positions I was paper trading and kept the bare minimum in my watch list. For now, I am tracking the symbols from the table below. Most of these where picked up on the triple-screen setup I mentioned earlier.

Symbol Last Trade Change Volume
KOSP 1:09PM ET 44.45 Up 0.08 Up 0.18% 328,418
KCI 1:04PM ET 27.77 Down 0.09 Down 0.32% 313,700
CEO 12:59PM ET 89.78 Up 0.18 Up 0.20% 89,100
SCVL 1:07PM ET 20.62 Down 0.23 Down 1.10% 43,122
TUG 1:03PM ET 21.94 Up 0.14 Up 0.64% 21,600
DWA 1:03PM ET 20.35 Down 0.25 Down 1.21% 79,900

I will be gone on vacation for a week so I will resume my activities on August 21th. On my return, I plan on trying to compare various triple-screens. After the Force Index, I plan on trying a setup using Elder-Ray. On the 21st, I will have only a few days left of TeleChart trial so I have to act quick. Still no news from the good folks at Reuters concerning MetaStock.

ZICA and BLJ

Let me start with a disclaimer: Anything read here should be considered very “amateurish” as I am as green as can be when it comes to technical analysis. This blog is more a tool for me than for anyone else at this point. I am not trying to teach anything, I am brain dumping so I can refer to is later.

Today, ZICA and BLJ cought my attention. They both look they could be potential candidates.

BLJ is my current favorite. The long term trend is up, the BOP is turning positive and I am the Elder’s Force Index crossed below zero recently. We seem about to get a buy from the Stochastics indicator. I am watching it through the open, waiting for it to cross over 1.21.

ZICA‘s long term trend is a lot less attractive. But on the short term, we could get a quick climb up to 1.55, asssuming it breaks 1.21 early morning.