Candidates for 08/21/2007

Here is the list of my candidates for today. I will not trade all of those but will start watching them for short-term reversals.

Date Sym L/S Close MA(200) Vol MA(100) Reason
20070820 ABXA 6.94 6.84445 466778.96 1
20070820 BQI 4.21 3.842725 2832533.07 1
20070820 ELN 17.2 15.9547 5121419.96 1
20070820 NATI 31.14 29.38035 397914.84 1
20070820 RHT 20.06 -1 2306584.42 1
20070820 SA 24.73 16.8950955 420453.48 1
20070820 SIVB 51.8 49.88505 544114.06 1
20070820 SUNH 14.32 13.07505 502877.06 1
20070820 WPI 29.8 28.4945 1179048.25 1

1. 5 Consecutive down days.
2. Volume is 30% over the 10-day moving average.
3. Volume is 70% over the 30-day moving average.
4. Volume is 50% over the 50-day moving average.

Happy Trading!

Candidates for 08/20/2007

Here is the list of my candidates for today. I will not trade all of those but will start watching them for short-term reversals.

Date Sym L/S Close MA(200) Vol MA(100) Reason
20070817 BQI 4.37 3.844575 2829218.07 1
20070817 CHTT 56.89 56.73825 376421.26 1
20070817 CLB 100.96 88.52195 283457.68 1, 2, 4
20070817 CY 24.5 20.2272 4445083.82 1
20070817 ELN 17.78 15.9411 5107944.96 1
20070817 EMKR 8.58 5.34795 906261.87 1
20070817 JEC 60.21 49.849325 984888.44 1
20070817 RHT 20.38 -1 2303966.42 1
20070817 SPWR 65.08 50.0610745 1706693.49 1
20070817 TEN 31.66 28.2769 551773.73 1
20070817 WG 25.48 23.2435 391644.21 1, 4

1. 5 Consecutive down days.
2. Volume is 30% over the 10-day moving average.
3. Volume is 70% over the 30-day moving average.
4. Volume is 50% over the 50-day moving average.

Happy Trading!
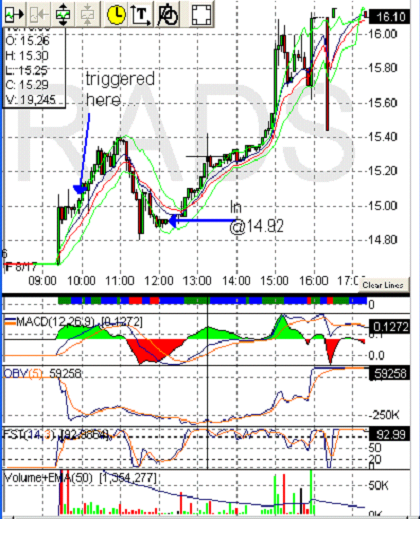
RADS – in @ 14.92

RADS – in @14.92

Friday, August 17, 2007

5:46 PM

Hats off goes to the good people at http://www.stocktiger.com for the tip. RADS triggered early today, around 10am. I miss the first triggered and when I noticed it, it was down. I waited for the impulse to turn again and picked it up around noon at 14.92. In finished the day at 16.10 with a nice run up.


This choppy market is horrible for swing traders who hold for a couple of days. RADS could very easily give it all back over the weekend. But I am trying anyway.


Screen clipping taken: 8/17/2007, 5:46 PM


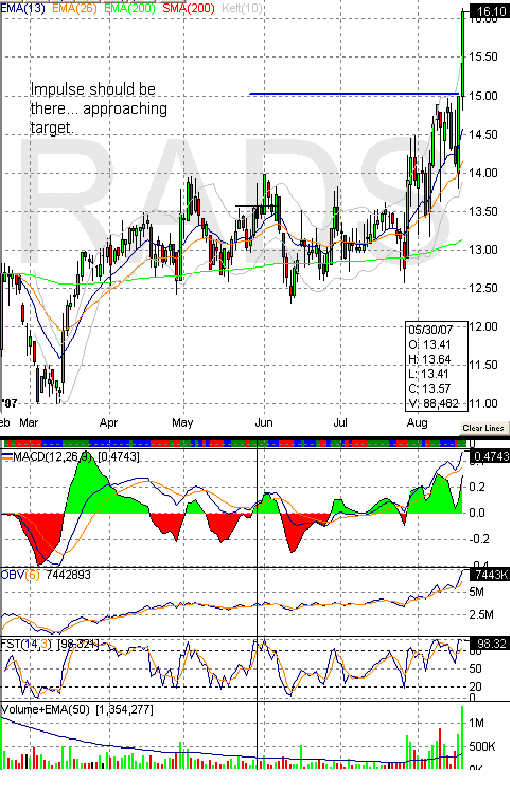
Here is a look at the daily chart for RADS. It really broke out of the range late July, after having retested the 14.00 level in early May and early June.


The price broke out today on positive news.


Screen clipping taken: 8/17/2007, 5:50 PM


Candidates for 08/17/2007

Here is the list of my candidates for today. I will not trade all of those but will start watching them for short-term reversals.

Date Sym L/S Close MA(200) Vol MA(100) Reason
20070816 ADVS 38.55 35.455825 289362.41 1
20070816 AFL 51.55 48.9399 2318887.47 1, 4
20070816 ALTR 22.88 21.43395 7159864.69 1, 4
20070816 ALXN 57.91 44.7534125 860399.4 1
20070816 AMAT 20.33 19.1346115 27714318.92 1
20070816 AMSC 20.06 14.235599 605220.75 1
20070816 ARXT 40.6 40.2945 647083.26 1
20070816 BEZ 42.19 39.946 526669.38 1
20070816 BG 81 77.392 1321808.07 1
20070816 BRL 52.59 51.48935 1149610.99 1
20070816 BRP 52.5 50.12955 386792 1, 2, 3, 4
20070816 BUCY 60.35 56.9084 859183.35 1
20070816 BVN 33.57 31.66296 537568.31 1, 4
20070816 BWA 77.29 74.200695 406412 1, 2, 3, 4
20070816 CEO 97.02 93.77785 408277.01 1, 2, 3, 4
20070816 CHTT 57.21 56.6657 373595.62 1
20070816 COR 2.4 2.1015405 255500 1, 2
20070816 CRR 45.46 42.115965 359637.71 1, 4
20070816 CSCO 29.3 27.174234 53936794.65 1, 4
20070816 CVD 70.41 63.3846 414683 1
20070816 CW 45 40.43806 267923.26 1, 3, 4
20070816 CY 24.61 20.18835 4435466.99 1, 4
20070816 D 85.59 85.4721 2678803.82 1
20070816 DGX 53.44 51.6216 1879513.36 1, 2
20070816 DISCA 22.46 19.52405 2415793.79 1
20070816 EBAY 33.64 32.5851395 15783343.51 1
20070816 EDU 46.8299 42.4368285 379022.4 1, 2, 4
20070816 ELN 18.23 15.92575 5093947.96 1, 2
20070816 EMKR 8.63 5.33415 905742.19 1
20070816 EQIX 85.98 83.42925 597278.76 1, 3, 4
20070816 EQT 47.43 46.7645 916027.84 1, 2, 3, 4
20070816 EV 38.31 37.4262 799953.22 1, 2, 3, 4
20070816 EXPD 44.17 43.9206 1743782.35 1
20070816 FCEL 7.53 7.09765 1681726.86 1, 4
20070816 FXI 119.74 110.42605 2688881.49 1, 2, 3, 4
20070816 GFIG 69 66.88745 347429.98 1, 4
20070816 GNTX 19.19 17.61825 1310670.21 1
20070816 HLX 36.07 35.874 1407573.57 1
20070816 HOKU 8.4 5.7311185 2712916.61 1
20070816 HXL 21.07 20.0441 992185.5 1, 4
20070816 IFLO 18.5 15.746555 289026.42 1
20070816 ISE 64.65 54.81305 991877.09 1, 2, 3, 4
20070816 ISLN 9 -1 523476.96 1
20070816 ITRI 77.89 64.5213 685873.31 1, 2, 3, 4
20070816 JEC 60.26 49.735225 974136.41 1, 4
20070816 KDN 50.75 45.55555 329530.07 1
20070816 KO 53.58 49.9105 10087472.02 1
20070816 LNG 35.6 32.48805 585420 1
20070816 LVS 92.32 87.7855 3234577.09 1
20070816 MCHP 36.94 36.6518755 2370157.52 1
20070816 MGM 68.61 68.4079 2225858.2 1, 2, 3, 4
20070816 MON 62.72 56.9212 3697284.56 1, 2, 3, 4
20070816 MR 30 25.97855 660249.14 1, 2, 3, 4
20070816 MRK 49.46 47.3055 12420803.5 1, 2, 4
20070816 MT 53.82 52.40235 2434766.61 1, 4
20070816 OPSW 13.89 8.90489999999999 3321610.51 1, 2, 4
20070816 ORCL 19.14 18.50825 29468373.03 1, 2
20070816 PBW 19.99 19.103 499628.16 1, 2, 3, 4
20070816 PCP 119.1 101.1434 1466681.63 1, 2, 3, 4
20070816 POS 30.49 29.82525 463965.07 1
20070816 RBY 1.45 1.3309125 425868.64 1, 2, 3, 4
20070816 REP 35.71 35.17535 450717.5 1
20070816 RHT 20.46 -1 2306151.42 1, 2, 4
20070816 ROH 53.52 53.11345 1198555.21 1
20070816 RRC 35.23 33.4204 1590596.12 1, 4
20070816 SID 43.37 41.37725 1134278.59 1, 2, 3, 4
20070816 SLAB 34.37 33.3061125 1131270.87 1, 2, 4
20070816 SLB 85.84 72.96695 10115307.74 1, 2, 4
20070816 SPWR 65.32 49.9032745000001 1707516.48 1, 2, 3, 4
20070816 STJ 43.01 40.518 2807053.48 1
20070816 TASR 13.56 9.9312995 3785695.33 1, 2
20070816 TEN 31.77 28.2322 548107.73 1, 2, 3, 4
20070816 TNE 19.31 16.40185 2418718.34 1
20070816 TSL 41.75 -1 1110562.09 1, 2, 3, 4
20070816 URRE 7.82 7.6846185 690082.43 1
20070816 UTHR 64.48 59.37945 766386.56 1
20070816 VDSI 26.97 18.334124 820475.31 1, 4
20070816 WERN 19.11 19.08685 959285.38 1, 2, 3, 4
20070816 WFII 2.04 1.9688745 685792.83 1
20070816 WG 25.9 23.1911 385396.21 1, 2, 3, 4
20070816 WPS 47 -1 988202 1, 4
20070816 ZOLT 35.18 32.3112985 807607.81 1, 2, 3, 4

1. 5 Consecutive down days.
2. Volume is 30% over the 10-day moving average.
3. Volume is 70% over the 30-day moving average.
4. Volume is 50% over the 50-day moving average.

Happy Trading!
Candidates for 08/16/2007

Here is the list of my candidates for today. I will not trade all of those but will start watching them for short-term reversals.

Date Sym L/S Close MA(200) Vol MA(100) Reason
20070815 ACAD 15.16 11.384675 745805.99 1
20070815 ADVS 39.02 35.450025 285371.86 1
20070815 AFL 51.74 48.90755 2284776.47 1
20070815 ALC 8.5 -1 390774.26 1
20070815 AMAT 20.36 19.1192615 27509126.22 1
20070815 ARXT 40.65 40.30655 647800.59 1
20070815 ATU 57.24 53.93235 304139.59 1
20070815 BBD 22.62 21.72655 4327957.05 1, 2, 3, 4
20070815 BG 84.8 77.295 1315211.07 1
20070815 BOBJ 38.95 38.7508 1422821.99 1
20070815 BRL 53.17 51.4799 1145620.92 1
20070815 BRP 53.76 50.0333 381165 1
20070815 BRY 33.42 33.12775 567817.42 1
20070815 BUCY 60.46 56.8185 855816.55 1
20070815 BVN 35.52 31.623125 530942.31 1
20070815 CBEY 35.61 33.29425 364675.07 1
20070815 CEO 102.47 93.71525 402952.01 1
20070815 CERN 56.27 52.4899 741850.51 1
20070815 CLC 36.84 33.8656 338595.2 1
20070815 COO 51.65 50.836555 593901.22 1
20070815 CP 64.33 61.40211 494619.88 1
20070815 CSCO 29.92 27.146334 53352453.65 1
20070815 CVD 71.35 63.32405 417104 1
20070815 D 86.32 85.44735 2650657.01 1
20070815 DGX 53.67 51.6029 1871048.36 1
20070815 DHR 74.53 73.30825 1924223.78 1
20070815 DISCA 23.74 19.4859 2413436.9 1
20070815 DLTR 36.76 36.5389 1350652.23 1
20070815 DST 73.38 73.1152999999999 702164.11 1
20070815 EBAY 34.53 32.5772895 15800794.41 1
20070815 EDU 48.19 42.326429 373705.4 1
20070815 EMKR 8.69 5.31955 900463.51 1
20070815 EQT 48.6 46.73195 899830.84 1
20070815 ERES 9.9 8.036 399902.14 1
20070815 ETY 16.85 -1 303415.25 1, 2, 3, 4
20070815 EV 39.1 37.38835 770312.22 1, 4
20070815 EWP 56.33 56.1111765 250387.19 1
20070815 EWT 14.78 14.6510495 6582074.43 1, 2, 4
20070815 EWZ 52.96 52.10255 9378108.13 1, 2, 3, 4
20070815 EXC 69.12 68.1234 4136148.92 1
20070815 EXG 16.57 -1 644578 1, 2, 3, 4
20070815 EXPD 45.31 43.934285 1729612.95 1
20070815 FCEL 7.84 7.0951 1680767.33 1
20070815 FIS 46.98 46.9786 1241724.68 1
20070815 FLS 63.53 60.17455 474229.77 1, 4
20070815 FNSR 3.63 3.548475 5886739.54 1
20070815 FXI 122.57 110.2496 2609712.44 1
20070815 GE 36.9 36.7284 39419586.27 1
20070815 GFIG 69.92 66.81865 341973 1, 4
20070815 GGB 20.85 19.64425 2107944.25 1, 2, 4
20070815 GNTX 19.84 17.6012 1305531.68 1
20070815 HURN 61.77 58.8167 265002.84 1
20070815 HXL 21.5 20.01955 975048.41 1
20070815 ICE 134 132.1132 3239114.76 1, 2
20070815 IIIN 18.3 18.1034505 293537.41 1
20070815 ISE 64.71 54.74755 982660.42 1, 3, 4
20070815 ISLN 9.31 -1 520479.64 1
20070815 JCG 44.62 41.51355 724116.22 1
20070815 KO 53.83 49.87695 10014388.02 1
20070815 LRCX 51.5 51.1938395 3244791.31 1
20070815 LWSN 9.39 8.46085 3668255.76 1
20070815 MA 129.04 120.49225 3508708.6 1
20070815 MAFB 47.63 47.254125 355532.88 1
20070815 MCD 47.56 46.66745 7746592.71 1
20070815 MGM 71.17 68.282 2187003.47 1
20070815 MR 31.99 25.92295 643604.14 1
20070815 MRK 49.78 47.28865 12314377.7 1
20070815 MT 55.34 52.34735 2420464.97 1
20070815 NAK 11 10.3637435 412489.21 1
20070815 ORCL 19.18 18.50305 29548006.33 1
20070815 PANL 14.82 14.448775 274698.99 1
20070815 PAYX 44 39.993738 3830002.91 1
20070815 PBW 20.31 19.09165 479868.16 1
20070815 PCP 124.4 100.8829 1430108.74 1
20070815 PETS 13.97 12.8524495 318349.73 1
20070815 PHO 19.68 19.3056 629246.26 1, 2, 3, 4
20070815 POS 30.73 29.7988 463628.07 1
20070815 PRST 6.62 6.56805 279004.45 1
20070815 RBY 1.67 1.3261275 415779.64 1, 2, 3, 4
20070815 REP 35.96 35.16135 448096.5 1
20070815 RHT 21.01 -1 2287464.42 1
20070815 ROH 54.09 53.1066 1186044.21 1
20070815 SFD 29.94 29.21935 1203643.23 1
20070815 SIAL 45.02 41.1764375 854934.33 1
20070815 SID 47.5 41.3177 1099557.62 1, 4
20070815 SLB 87.24 72.8518 10043522.54 1
20070815 STJ 43.34 40.4734 2794468.48 1
20070815 STP 37.1 35.14875 2523407.17 1
20070815 STXS 13.35 11.50725 319238.82 1
20070815 TEN 32.76 28.18625 542847.73 1
20070815 TNE 19.64 16.37905 2405109.34 1
20070815 TSL 47.94 -1 1095541.09 1
20070815 UPS 74.23 73.56965 4067529.37 1
20070815 UTHR 64.68 59.3622 770041.29 1
20070815 VRTX 34.9 33.3822495 2157312.16 1
20070815 VVUS 5.07 4.6200495 567617.28 1
20070815 WFII 2.06 1.9703745 691844.59 1
20070815 WFT 50.98 47.5512 4543628.9 1
20070815 WG 26.21 23.13655 377126.21 1, 2, 3, 4
20070815 WINN 24.29 -1 703228.53 1
20070815 WPS 48.77 -1 1046283 1
20070815 WTW 52.81 50.1408 374847.42 1

1. 5 Consecutive down days.
2. Volume is 30% over the 10-day moving average.
3. Volume is 70% over the 30-day moving average.
4. Volume is 50% over the 50-day moving average.

Happy Trading!

Candidates for 08/15/2007

Here is the list of my candidates for today. I will not trade all of those but will start watching them for short-term reversals.

Date Sym L/S Close MA(200) Vol MA(100) Reason
20070814 ASX 6.01 5.99139 667231.96 1
20070814 BG 85.23 77.18445 1309216.07 1
20070814 BOBJ 39.49 38.74345 1425237.99 1
20070814 FO 82.6 81.24665 965280.85 1
20070814 GBN 2.27 2.185309 406071 1, 2, 3, 4
20070814 HAL 32.89 32.73615 20283240.28 1
20070814 MGM 72.74 68.1434 2182762.49 1
20070814 ORBC 7.86 -1 353860.04 1, 2, 3, 4
20070814 PETS 14.21 12.8462995 319011.63 1
20070814 TEN 33.74 28.13755 542370.73 1
20070814 VFC 85.05 84.1769999999999 641615.16 1

1. 5 Consecutive down days.
2. Volume is 30% over the 10-day moving average.
3. Volume is 70% over the 30-day moving average.
4. Volume is 50% over the 50-day moving average.

Happy Trading!

Candidates for 08/14/2007

Here is the list of my candidates for today. I will not trade all of those but will start watching them for short-term reversals.

Date Sym L/S Close MA(200) Vol MA(100) Reason
20070813 ASX 6.02 5.98419 663968.96 1
20070813 BG 86.79 77.0526 1305547.07 1
20070813 PHRM 39.79 28.377825 819838.5 1

1. 5 Consecutive down days.
2. Volume is 30% over the 10-day moving average.
3. Volume is 70% over the 30-day moving average.
4. Volume is 50% over the 50-day moving average.

Happy Trading!