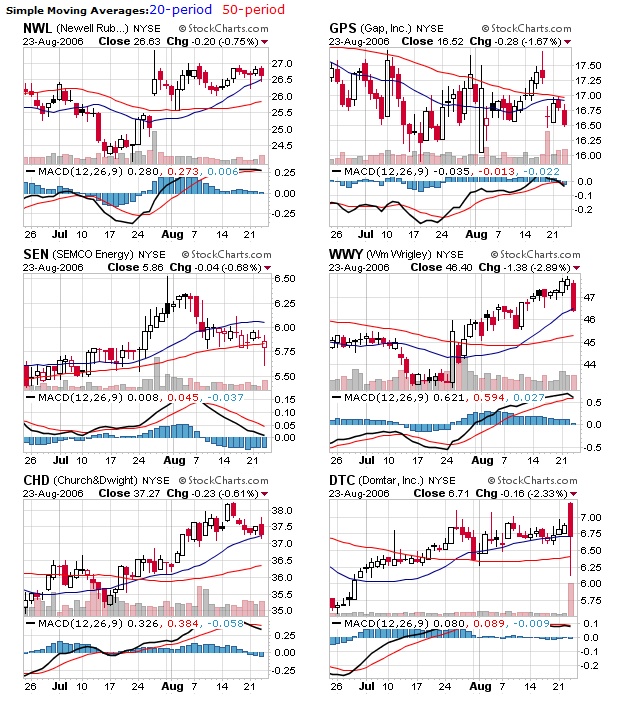
Watch List for August 24th 2006

Here is an overview of the new items on my watchlist for today. I would consider these as long swing candidates. All these are symbols with very bullish outlooks on the weekly charts but are down on the short term. The plan is to wait for a reversal by flagging the items on the watchlist and buying (paper still) if they poke through the previous day’s high. Once in, I fix my target near the upper channel line and set a protective stop somewhere below today’s or yesterday’s low.

WatchList

Charts for today's watchlist

The goal is to stay in from 2 to 4 days and take the profit at the upper channel. A trailing stop order will follow the progress of the stock and bail-out at any sign of pullback.

Closed a few more paper trades

I just closed 4 more paper trades and I re-evaluated my current results. My PnL has just turned green which made me happy. My winning probabiliy is at 44% by my W/L ratio is at 1.23. Using the Kelly Criterion I get K% = 1.21 meaning I should not currently commit more than 1% of my capital in one equity. So in the current conditions, I would need a failry large amount of capital to make money with limited risk. I will try to improve this in the coming weeks.

My ability to paper trade will be limited shortly because my trial to Worden’s TC expires in a couple of days and I am not ready to start paying the subscription yet (I am somewhat stuck in a catch 22). I am not sure what I will do yet as I have some more PCFs and indicators to build. I could probably try to use something cheaper for the moment.

Currently tracking and Upcoming vacation

I unwound a bunch of positions I was paper trading and kept the bare minimum in my watch list. For now, I am tracking the symbols from the table below. Most of these where picked up on the triple-screen setup I mentioned earlier.

Symbol Last Trade Change Volume
KOSP 1:09PM ET 44.45 Up 0.08 Up 0.18% 328,418
KCI 1:04PM ET 27.77 Down 0.09 Down 0.32% 313,700
CEO 12:59PM ET 89.78 Up 0.18 Up 0.20% 89,100
SCVL 1:07PM ET 20.62 Down 0.23 Down 1.10% 43,122
TUG 1:03PM ET 21.94 Up 0.14 Up 0.64% 21,600
DWA 1:03PM ET 20.35 Down 0.25 Down 1.21% 79,900

I will be gone on vacation for a week so I will resume my activities on August 21th. On my return, I plan on trying to compare various triple-screens. After the Force Index, I plan on trying a setup using Elder-Ray. On the 21st, I will have only a few days left of TeleChart trial so I have to act quick. Still no news from the good folks at Reuters concerning MetaStock.

Progress Report

Using the previously described setup, I have been making numerus paper trades to try and analyze the results. I am definitely not ready for active trading yet. My probability of for a win [p(W)] was only 0.42. I calculated my Win/Loss ratio value which was negative @ -0.93. I do not mind keeping my p(W) that low, though it would make things harder, but I need to turn profits before I go live. Ideally, I want to know I can cover the costs of some of the tools I will need.

Which is bringing me to a bottleneck because my TeleChart trial expires, it will be more difficult to paper trade and try different scans and pcfs.

Since I cannot find a trial for MetaStock, I may have to buy it for a month to try it. Than decide on the final tool used and subscribe prior to going live to finish setting up my strategy.


New Triple-Screen setup

Testing new triple-screen setup using pcf’s in TeleChart.

The first filter, look for a positive long term trend using weekly data. The filter looks for a positive slope on the weekly MACD Histogram using:


(XAVGC26 - XAVGC12) -
(XAVGC26.4 - XAVGC12.4) > 0
  

The first term represents today MACD bar and the second, the MACD bar 5 days ago. I need the difference between the two to be positive to find bullish long-term trends.  

The second filter, looks a daily data and uses the Elder’s Force Index. If the FI turns negative on an uptrend day, it may be a buying opportunity. The formula looks like:


((((V*(C-C1))+(V1*(C1-C2)))/2) < 0) AND ((((V1*(C1-C2))+(V2*(C2-C3)))/2) > 0)
  

The first term indicates a negative FI for the current day. The second term indicates a positive FI value prior to that. Additional positive days could be added also.  

This is setup in one Scan which run at night after the market closes, generating a list of stocks with bullish long-term trends but with a daily downtrend. I weed out some of the less interesting ideas by taking out low volume instruments using another pcf:


(AVGV126 > 1000) AND
(V > AVGV63)
  

During the following trading day, I simply have to look in that list for intraday breakouts on any of those stocks. I setup another pcf which looks at the current price and compares it to yesterday’s high.  


C > H1
  

If try, I have my third buy signal. TC2007 is not the right tool for the third scan, a limit order directly with the broker would work best or any other realtime market scanner but I am currently paper trading so I run this other scan to find ideas.  

This is my first test on a triple-screen. I plan on setting up various triples using different indicators and comparing results.


ZICA and BLJ

Let me start with a disclaimer: Anything read here should be considered very “amateurish” as I am as green as can be when it comes to technical analysis. This blog is more a tool for me than for anyone else at this point. I am not trying to teach anything, I am brain dumping so I can refer to is later.

Today, ZICA and BLJ cought my attention. They both look they could be potential candidates.

BLJ is my current favorite. The long term trend is up, the BOP is turning positive and I am the Elder’s Force Index crossed below zero recently. We seem about to get a buy from the Stochastics indicator. I am watching it through the open, waiting for it to cross over 1.21.

ZICA‘s long term trend is a lot less attractive. But on the short term, we could get a quick climb up to 1.55, asssuming it breaks 1.21 early morning.

And so it begins

Everybody has to start somewhere right… I am very new to this game but I love technical analysis so far. I have very inspired by several books, including one of favorite “Trading for a Living” by Dr. Alexander Elder. I was also very inspired by current bloggers, mainly Trader Mike who has a wealth of information on his blog and is just a pleasure to read.

I cannot afford to day-trade at the moment because of the PDT regulations so I plan to stay in the swing/positions trading window. Right now I am basically working on scans and PCFs on TC2007 and paper trading them to see what I like and feel confortable with. I may give MetaStock from Equis a try before settling on TeleChart. I want to develop decent scans to find 2-3 good setups which I would hold for 2-4 days. Not a way to make a fortune, just a sideline and a way NOT to lose a fortune.

My current trading account is fairly inactive, I am looking for good exits on some positions I was holding for a while. Once I have everything liquidated, I will transfer the assets to IB to try and save on commissions.

I do not plan on doing this full-time ever.