Long UVV

I have no positions in UVV yet but I am considering it as a long. It popped on my Candidates list this morning and I thought it was a nice chart. First the big picture:

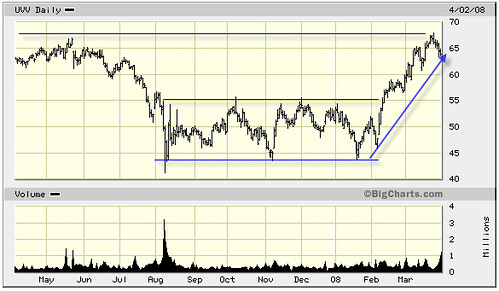
From this BigChart, we see a wide 10pts base. The price stayed in that 45-55 range from August 2007 up until early February. At that last up swing, it broke right through the 55 resistance and reach levels from a year ago.
On the candlestick chart:

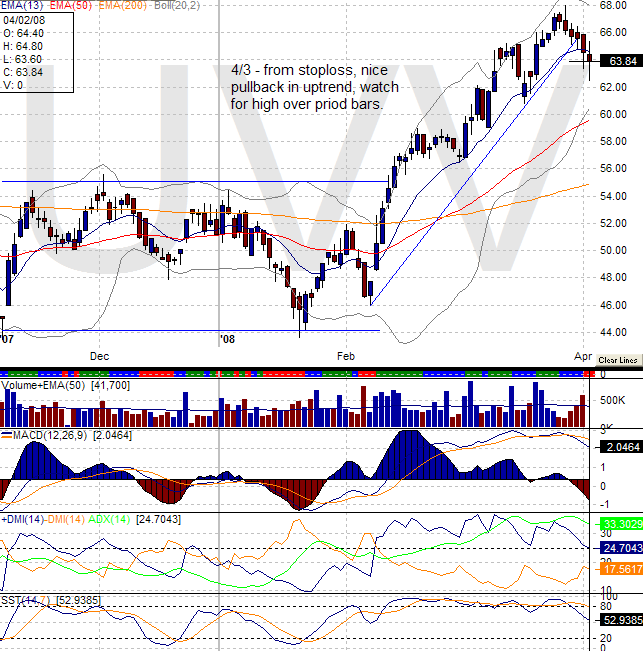
Based on several factors (the size of the base, the ADX/DMI indicator and the size of the pullback), I still consider UVV in a pullback only which means the trend should resume shortly. A good to play this stock would be an entry above the open 2 days ago (around 66 for 4/3) with a safe up move to last resistance levels (68). At that level, keep the stops a lot tighter and watch for another reversal but ride it until the next pullback.

Take a look at BGO

I have been keeping an eye on BGO recently. BGO is Bema Gold Corp, a Gold mining company. A quick look at the weekly chart reveals BGO had a nice uptrend for a good part of 2005 and half of 2006. Mid-2006, the price started consolidating and bounced between a support at 4.25 and resistance around 6. The price currently sits near the resistance and the weekly impulse signal has been green for several bars.

Continue reading

ROIAK

ROIAK or Radio One Inc., the radio station owner and operator, just made it on my watch list. As usual, I am sticking to fairly cheap instruments. The weekly charts tells me ROIAK may have formed a bottom last August, making it an attractive long. The current weekly trend is up and the impulse signal is green meaning the MACD histogram slope is up and the EMA is also trending up. So we have both momentum and inertia favoring the bulls. The weekly chart also formed a small bullish divergence between the May 06 bottom and August 06 bottom where the MACD traced a higher bottom.

Continue reading

NGAS

I will be watching the progress of NGAS in the coming week. The weekly chart gives a blue impulse signal which is not ideal but permits me to trade long if I so desire. The MACD histogram is up but the EMA still shows a down trend. I think the weekly primary trend is down but chart shows regular upswing so I could trade this between the channel lines.

Continue reading

FAF long above 42.10

Reading charts tonight I fell on FAF which attracted my attention and would consider getting in around 42.10 with a stop around 40.39. The weekly chart shows a potential uptrend with the EMA trending up and the MACD histogram slope is also up (Elder‘s Impulse System). On the daily chart I see the same pattern: EMA trending up and MACD histogram sloping up also. The TSV recently crossed under which could indicate a good entry point.

Continue reading

SVNT, UNTD and trading with the trend

As you may know, I trade few titles and hold for a couple of days only. I usually look to hold 1-5 days. This may be elementary comment to most but as I many a times, I am green. I was never really paying attention to the general market directions. I think was getting getting dropped out at my stops when the market in general was moving against my trade. so for January. I will start looking at general market trend and try to trade with the trend only.

For the short-term, we have the NASDAQ down, the S&P somewhat lateral and the Dow still up. So for today, I was hunting for a few shorts on NASDAQ only. I am starting with two titles for now: SVNT and UNTD.

Continue reading

OSG and SWC on 12/28/06

I am attempting to post position trading candidates again. I intend to slap a couple of charts on once in a while for positions trading. Again, these are not for day trading so positions should be valid for a couple of days. I have not yet decided wether I will follow-up when I close my interest in these. Today I look at OSG and SWC. FYI, I am again going back to my first love and maintaining a list of current candidates on StockTickr.

Continue reading