Candidates for 02/25/2008

Here is the list of my candidates for today. I will not trade all of those but will start watching them for short-term reversals.

Date Sym L/S Close MA(200) Vol MA(100) Reason
20080222 ALNY 29.3 26.90 453109 1
20080222 ASTI 15.11 13.49 681971 1
20080222 CRDC 8.38 7.92 496789 1
20080222 CSUN 7.24 -1.00 2970921 1
20080222 FBCM 6.26 -1.00 256841 1, 2
20080222 INCY 9.91 7.95 1424613 1
20080222 OTEX 31.75 26.56 645168 1
20080222 TMTA 12.75 6.43 259864 1, 2, 4
20080222 UTHR 81.98 78.33 930428 1

1. 5 Consecutive down days.
2. Volume is 30% over the 10-day moving average.
3. Volume is 70% over the 30-day moving average.
4. Volume is 50% over the 50-day moving average.

Happy Trading!

Pre-market 2/25/08

I really wished I did this exercise every day. And if I traded full-time, it is definitely something I would do. But as a part-timer, life sometimes takes over and good intentions drop on the wayside. Pre/Post market analysis, diet and exercise and early bed time are the first things to go, but I digress. Knowing if the market went up or down is one thing, but taking 30 to 45 minutes each day to look closely at the charts of market indicators reveals a lot about the current conditions. On top of it, the media bombards us with their analysis of the situation but doing your own really allows you to tie it with your own trading style. I may look into at least making a weekly out of it. But I hope that practicing makes me faster at it, making it easier to integrate in my daily routine.

Weird day today, market was down most of the day but with no real conviction. Lack of interest, snow in NY and plain inertia kept the trend from Thursday going. Things rebounded around 3:30pm mainly on positive news in the financial sector in the form of an Ambac bailout.

I am playing with the layout and the size of the charts, trying to make sure I can produce them quickly but that they are all readable.


Long-term

Intermediate

Short-term

NASDAQ

Down

Sideways

UP*

Dow

Down

Sideways

UP*

S&P

Down

Sideways

UP*


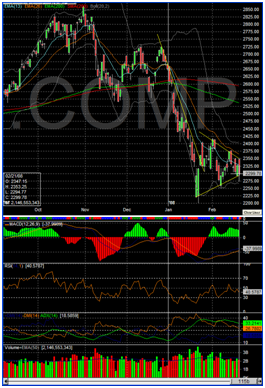
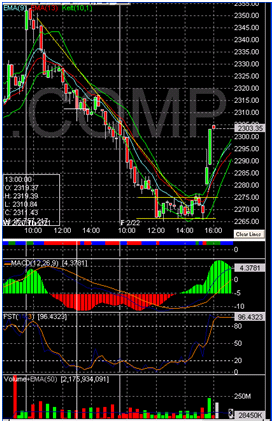
No big changed on the daily charts. I consider we are still in range and in the triangle until we break an upped boundary. Breaking that recent 2350 high would be a start.

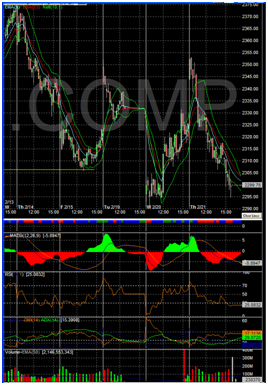
The first part of the day simply continued the downtrend from yesterday. The market went sideways around noon and broke up near 3:30pm. We saw a little profit taking already right on the last bar so guesses for Monday are hard to make.

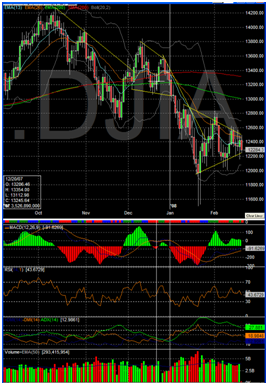
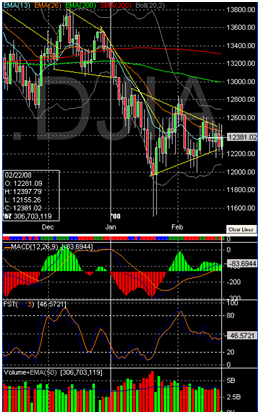
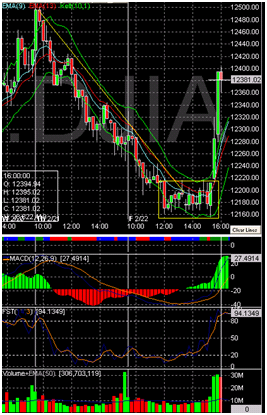
The DOW is also still in range. Getting back near 12600 would be a great step out of this range. So far the triangle is still getting narrower, so a big down move, breaking down the bottom of the wedge would worry me.

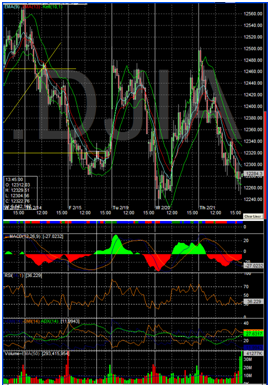
The 15min chart followed the day’s pattern. Down until noon and sideways until it broke up at 3:30pm.

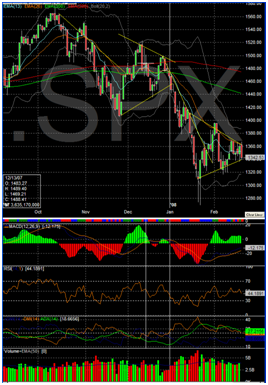
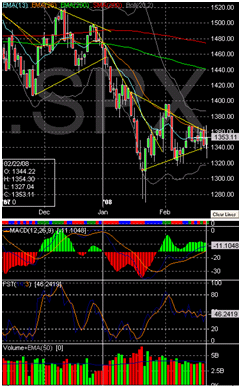
On the S&P chart, the wedge seems to be broadening. For the last 3 or 4 bars, the day’s range has been increasing so something is brewing.

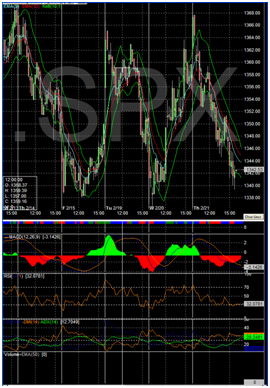
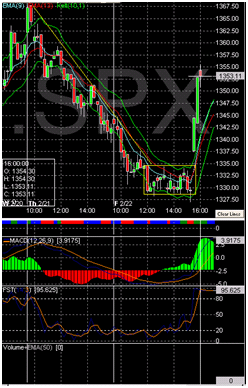
Same pattern on the 15min S&P chart.


Pre-market 02/22/2008

In most market indicator charts, I see two major downtrend moves early this year, each followed with sideways action. We are currently in that second sideways movement and probably near the end as the triangles are closing up. Everybody is looking for a bottom but everyone is on their guard which makes another down movement likely. I think people are ready to buy back an upwards movements and signs of recovery but just as likely to panic and drop out if they see other signs of drop movements. Yesterday word of the day was stagflation.

On a personal note, I do not seem to be trading well in range conditions but I do not know why yet. One of the reasons for this post is to 1) get better a detecting current market conditions and 2) try to improve my trading in all conditions.

Overall, since I trade a lot of break-out candidates, I put money on a lot of false breakouts when the market stalls like this. Trending market, either up or down offer better breakout action I think.

Long-term Intermediate Short-term
NASDAQ Down Sideways Down
Dow Down Sideways Down
S&P Down Sideways Down
The daily NADAQ composite chart shows the range we are currently trading in. We had to down moves so far this year, each followed with a couple of weeks of sideways trading. The 60 minute chart of the NASDAQ Composite shows the short-term down movement from Thursday.
The DOW showed a similar pattern. The later part of January and February has been in a triangle range/consolidation phase. The triangle is closing up but nobody seems certain of what the next movement will be. The 60 minutes shows the wide swings this range trading presents.
Again, same pattern on the S&P chart. Two down trend moves and two consolidation phases. We are in the second consolidation. I see no clear bottom indication yet, which doesn’t mean it’s not here. Just means I don’t see it yet. Again, huge swings on the 60-minutes charts which makes my life a little difficult. I do not handle these markets well.

Candidates for 02/22/2008

Here is the list of my candidates for today. I will not trade all of those but will start watching them for short-term reversals.

Date Sym L/S Close MA(200) Vol MA(100) Reason
20080221 ALNY 30.4 26.85 451124 1
20080221 APP 12.15 12.07 259926 1
20080221 AUXL 31.08 22.79 466230 1, 2, 3, 4
20080221 CHP 5.44 5.28 280588 1
20080221 CSUN 7.57 -1.00 2973006 1
20080221 FBCM 6.5 -1.00 280872 1, 2
20080221 ITC 53.8 48.97 468903 1
20080221 KNDL 40.86 40.46 286582 1
20080221 KUN 4.6 -1.00 289534 1, 2
20080221 NSC 52.55 52.37 3581394 1
20080221 OTEX 32.7 26.52 645182 1
20080221 RIGL 19.65 12.87 1290026 1, 2, 3
20080221 UTHR 82.74 78.23 926048 1, 2, 3, 4
20080221 WMS 38.32 33.36 728166 1

1. 5 Consecutive down days.
2. Volume is 30% over the 10-day moving average.
3. Volume is 70% over the 30-day moving average.
4. Volume is 50% over the 50-day moving average.

Happy Trading!

Candidates for 02/21/2008

Here is the list of my candidates for today. I will not trade all of those but will start watching them for short-term reversals.

Date Sym L/S Close MA(200) Vol MA(100) Reason
20080220 AGG 101.3 100.10 572707 1
20080220 AUXL 31.72 22.70 456471 1, 2, 4
20080220 CHP 5.63 5.28 281807 1
20080220 DEPO 3.27 3.01 478528 1
20080220 KUN 4.8974 -1.00 293329 1
20080220 MC 19.8 19.41 437869 1
20080220 UTHR 84.93 78.11 915281 1, 2

1. 5 Consecutive down days.
2. Volume is 30% over the 10-day moving average.
3. Volume is 70% over the 30-day moving average.
4. Volume is 50% over the 50-day moving average.

Happy Trading!

Candidates for 02/20/2008

Here is the list of my candidates for today. I will not trade all of those but will start watching them for short-term reversals.

Date Sym L/S Close MA(200) Vol MA(100) Reason
20080219 AGG 101.46 100.09 575676 1
20080219 CRL 57.96 57.14 708076 1

1. 5 Consecutive down days.
2. Volume is 30% over the 10-day moving average.
3. Volume is 70% over the 30-day moving average.
4. Volume is 50% over the 50-day moving average.

Happy Trading!

Candidates for 02/19/2008

Here is the list of my candidates for today. I will not trade all of those but will start watching them for short-term reversals.

Date Sym L/S Close MA(200) Vol MA(100) Reason
20080215 DPTR 21.03 18.19 1630935 1
20080215 VTA 13.95 -1.00 420179 1, 2

1. 5 Consecutive down days.
2. Volume is 30% over the 10-day moving average.
3. Volume is 70% over the 30-day moving average.
4. Volume is 50% over the 50-day moving average.

Happy Trading!