Candidates for 03/20/2008

Here is the list of my candidates for today. I will not trade all of those but will start watching them for short-term reversals.

Date Sym L/S Close MA(200) Vol MA(100) Reason
20080319 GEOY 27.74 27.47 317347 1
20080319 IMAX 6.25 5.20 393231 1
20080319 KMP 54.85 53.36 710114 1, 2
20080319 NX 49.04 47.72 489862 1, 2, 3, 4

1. 5 Consecutive down days.
2. Volume is 30% over the 10-day moving average.
3. Volume is 70% over the 30-day moving average.
4. Volume is 50% over the 50-day moving average.

Happy Trading!

Candidates for 03/19/2008

Here is the list of my candidates for today. I will not trade all of those but will start watching them for short-term reversals.

Date Sym L/S Close MA(200) Vol MA(100) Reason
20080318 CEO 149.29 148.11 549668 1, 2
20080318 GEOY 28.33 27.43 316914 1
20080318 KMP 56.18 53.36 701033 1, 2
20080318 NVT 67.25 66.79 2032707 1, 2, 3, 4
20080318 NX 49.94 47.73 488379 1
20080318 VION .4 -1.00 366935 1, 2, 3
20080318 WLM 0 -1.00 257475 1

1. 5 Consecutive down days.
2. Volume is 30% over the 10-day moving average.
3. Volume is 70% over the 30-day moving average.
4. Volume is 50% over the 50-day moving average.

Happy Trading!

Post-market 3/18/08

Big day on the board. There was a fed announcement today and another rate cut. 75 basis points this time so the new rate is 2.25%. I didn’t read the entire policy but it seems like the decision was far from unanimous and that 2 member wanted even less the 75 points, making 3/4 the compromise. The wording is being picked apart everywhere so I am not going to bother here.
Overall, things are not looking too too bad. The market showed resilience yet again when the fed delivered a cut under expectation. It was widely known that the full-monty was priced into the market by 2pm.
On the other hand, the dollar is still very weak, the oil is still high and I see no clear sign of recovery in the near term for the housing market.
Clearly we are not out of the woods yet because if things do not turn around soon, the Fed will eventually run out of bullets and we will see what many believe has already started and is just being delayed by the Fed actions: the recession.
I am not overly negative though and still pretty 50-50 on the issue. I would rather be ready to ride whatever comes than to try and predict what is coming and miss the target.
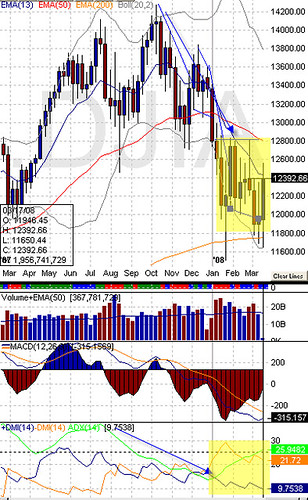
Lets look at the weekly chart for the Dow:

The weekly chart helps me get the big picture. We can see the down trend that prevailed starting last October. The way I read the chart, the downtrend ended when ADX turned upwards around the second week of January. Although January was a difficult month, the consolidation phase or sideways phase had started. The ADX has been climbing since but not strong enough to define a direction yet. A strong trend would need the ADX above 30. If the current up movement continues, we could end up crossing through 12800 with a strong ADX which would be an excellent bullish indicator for the market. But overall, the chart is also very telling with regards to market movement and volatility. We see a lot of very long bars going both ways.
Now for the daily chart:

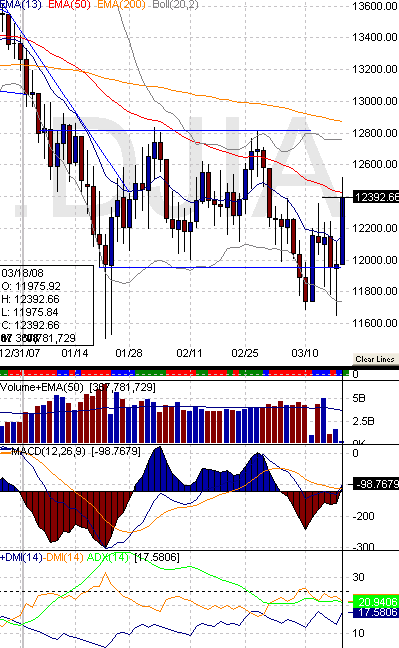
The daily chart show the current consolidation phase. The first push at the end of January was strong but no enough to break out. Now we have been bouncing back and forth and we can clearly see how the ADX shows the lack of trend in the current market.
And finally the 15-minutes chart:

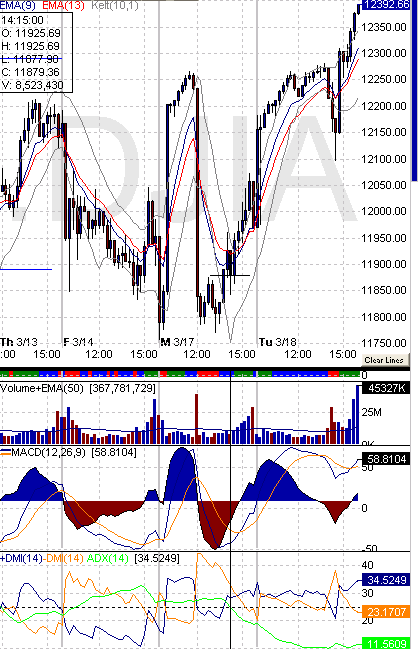
And think the chart says it all. The swing like yesterday’s two long 400 pts bars and today’s big 150 pts drop and quick recovery following the Fed announcement. Anyone trying to predict anything here must be having a field day.
Happy trading!

Candidates for 03/18/2008

Here is the list of my candidates for today. I will not trade all of those but will start watching them for short-term reversals.

Date Sym L/S Close MA(200) Vol MA(100) Reason
20080317 GSX 2.32 2.17 687055 1
20080317 PSD 26.1 25.59 908655 1
20080317 RCI 34.36 -1.00 503403 1
20080317 VION .4 -1.00 366935 1, 2, 3

1. 5 Consecutive down days.
2. Volume is 30% over the 10-day moving average.
3. Volume is 70% over the 30-day moving average.
4. Volume is 50% over the 50-day moving average.

Happy Trading!

Candidates for 03/17/2008

Here is the list of my candidates for today. I will not trade all of those but will start watching them for short-term reversals.

Date Sym L/S Close MA(200) Vol MA(100) Reason
20080314 GSX 2.41 2.17 687647 1
20080314 MIN 6.16 6.14 329660 1, 2, 3, 4
20080314 RCI 35.67 -1.00 500551 1, 2
20080314 VION .4 -1.00 366935 1, 2, 3

1. 5 Consecutive down days.
2. Volume is 30% over the 10-day moving average.
3. Volume is 70% over the 30-day moving average.
4. Volume is 50% over the 50-day moving average.

Happy Trading!

Post-market 3/14/08

A lot of people (including me) were expecting a positive open but BSC negative news quickly put the fear back in the market and down it was. I always find entertaining how mainstream media goes from “we are finally bouncing of the bottom” to “Doomsday!” in just 24hrs. The news and tone was clearly negative all day today.

Here is the trend table for today:

Intermediate Short-term
Dow Sideways Down
NASDAQ Sideways Down
S_P Sideways Down

Only DOW charts today:

Continue reading

Pre-Market 3/14/08

The futures were below fair value earlier this morning on worries about the economy and inflation on the day of the release of the new CPI number. The CPI remained to previous levels which eased concerns and the futures spiked up, putting us in good position for a positive open.
As of 08:30 am : S&P futures vs fair value: +5.0. Nasdaq futures vs fair value: +10.5. Have a good day!